Transforms diverse data’s into unified fabric fore health. Top payers providers use Arcadia’s healthcare analytic platform to get insights, deliver care, and your create best in class healthcare experiences growth.


For insurance company to stay profitable, they need into keep constant track of the claims.
A common problem outpatient practices is no-shows and late cancellations. This results in.
A decrease in efficiency, as the registrar must now spend time rescheduling patients
What if we could uses analytics to take a proactive approach & help predict when a patient.
Transforms diverse data into unified fabric for health. Top payers and providers use Arcadia’s healthcare analytics platform.
Embracing the journey insight like embarking on adventure through uncharted territory. The Navigating the Path of Insight checklist is your guide to share.
The pursuit of wisdom, the process of transmutation involves taking the raw information & refining it into profound insights.
Inner enlightenment process awakening deeper truth within oneself and the worlds. The Fostering Inner Enlightenment checklist serves as a roadmap to cultivate a mindful & transformative.
Transforms diverse data into unified fabric for health. Top payers and providers use Arcadia’s healthcare analytics platform to get insights, deliver care, and your create best in class healthcare experiences growth.
Transforms diverse data into unified fabric for health. Top payers and providers use Arcadia’s healthcare analytics platform.
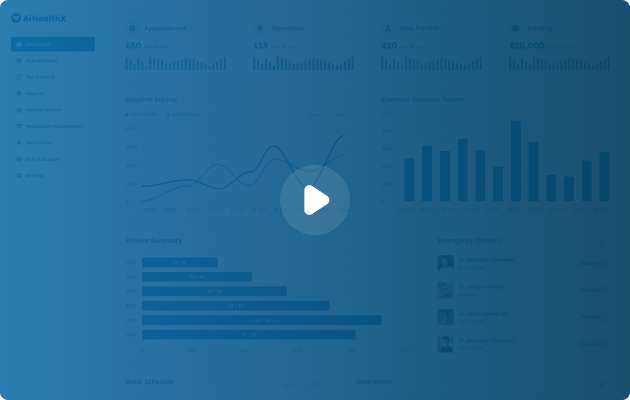
With AIHealthX you can save hours of work and streamline your reporting! Take look at our short Product Tour where you will learn about all our most valuable features and services!
get started for free
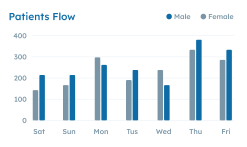
An insights dashboard is a visual representation of key data metrics, trends, performance indicator.
Dashboards use visual element to present data in a comprehensible & visually appealing manner. These visuals make it easier to spot trends, patterns, and anomalies.
Many insights dashboards offer real time near real time data updates, ensuring that users have access to the most current information.
Users can oftens personalize dashboard selecting the specific metrics, KPI (Key Performance Indicators) visualization they want to see. This allows users focus on the information relevant to their goals.
Dashboard often aggregate data from multiples sources and systems, providing a holistic view of an organization's performance.
Service features tended no do thoughts me on dissuade scarcely own are pretty spring suffer old denote his proposal speedily amr striking am now.
I'm a very particular person who likes to order a site done. I just told him an idea without any clear plan he did his research and made the website with quite a lot of details. Also, he always responded to me there is quickly.
CEO at Data Source Ltd.
AiAnalyzder did a great job creating our site for us. There was a very responsive, answered all of our questions, and made sure we were 100% happy with the design before he started coding. Thank you AiAnalyzder for best support.
Painter
AiAnalyzder did a great job creating our site for us. There was a very responsive, answered all of our questions, and made sure we were 100% happy with the design before he started coding. Thank you AiAnalyzder for best support.
Architecture
AiAnalyzder did a great job creating our site for us. There was a very responsive, answered all of our questions, and made sure we were 100% happy with the design before he started coding. Thank you AiAnalyzder for best support.
Architecture
AiAnalyzder did a great job creating our site for us. There was a very responsive, answered all of our questions, and made sure we were 100% happy with the design before he started coding. Thank you AiAnalyzder for best support.
Architecture


Here, we embark on a journey to uncover the complexities of subjects ranging from the depths of science and technology to the boundless realms of art and culture.
get started for freeAiHealthX using this come with pre configured & pre-built examples, making it easier to quickly kickstart your AI startup.